Week 2 Recap: All Four Portfolios Beat the S&P 500
Welcome to Week 2, which was another wild ride in the market. The markets have been reacting to the day-to-day news and fears about oil production in the Middle East. The VIX, widely known as the market's fear indicator, has whipsawed over the last two weeks but has mostly sat between 25 and 30, indicating heightened anxiety and meaningful volatility.
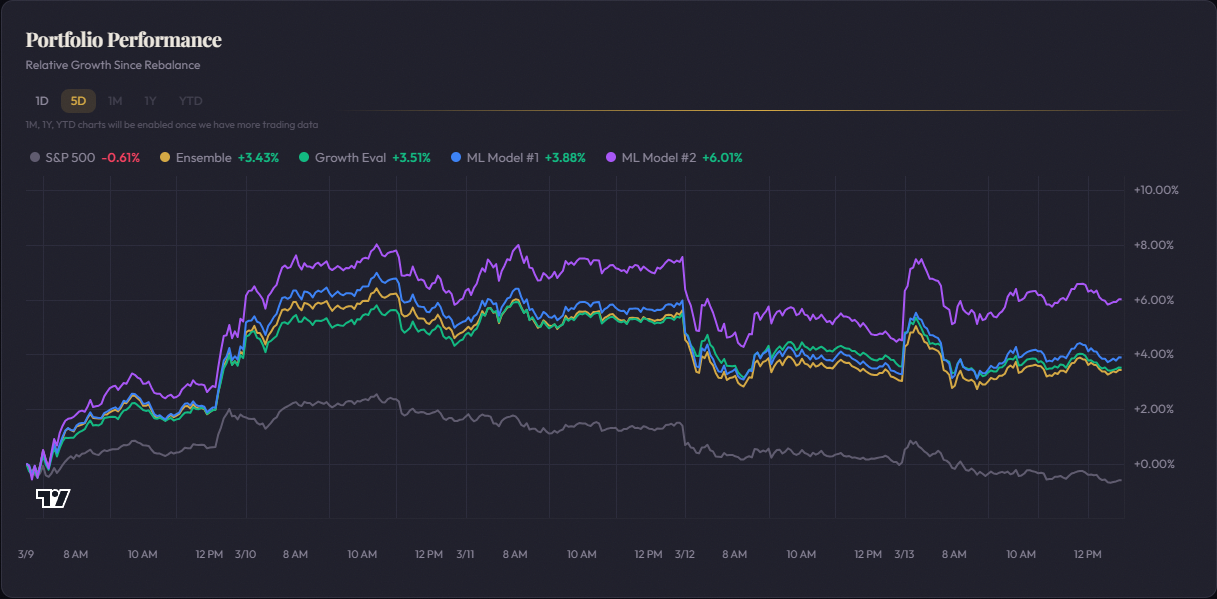
As for the portfolios, while the net results since launch are still mostly negative, they achieved their primary goal this week: outpacing the S&P 500. I have included the daily table and the 5-day chart below.
5-Day Chart (3/9 – 3/13)
Week 2 Performance
| Dates | S&P 500 | Ensemble | Growth Eval | ML Model #1 | ML Model #2 |
|---|---|---|---|---|---|
| Week 2 (3/9 – 3/13) | -1.39% | +2.38% | +2.53% | +2.86% | +5.12% |
Daily Breakdown
| Date | S&P 500 | Ensemble | Growth Eval | ML Model #1 | ML Model #2 |
|---|---|---|---|---|---|
| 3/9 | +0.92% | +2.94% | +2.87% | +3.15% | +4.33% |
| 3/10 | -0.10% | +0.78% | +0.66% | +0.98% | +0.79% |
| 3/11 | -0.22% | +0.77% | +0.91% | +0.74% | +1.44% |
| 3/12 | -1.33% | -2.45% | -1.85% | -2.55% | -2.84% |
| 3/13 | -0.65% | +0.39% | -0.03% | +0.60% | +1.44% |
Cumulative Since Launch (3/2)
| S&P 500 | Ensemble | Growth Eval | ML Model #1 | ML Model #2 | |
|---|---|---|---|---|---|
| Total | -2.78% | -0.83% | -0.08% | -0.98% | +0.31% |
The S&P 500 has lost 2.78% over the last two weeks, but all four portfolios have outpaced it. They are still slightly negative, with the one outlier being my experimental model (ML Model #2), which has eked out a slightly positive gain riding the success of The Trade Desk (TTD).
Some of you have reached out to congratulate me on this week's results. I appreciate that, but this is still a very small sample size, and the true success of these models will be proven over months of data.
With the war in Iran and a shaky labor market, we can assume continued volatility until Q1 earnings start rolling in, which may help provide market direction one way or another.
Thanks for reading!